Analytics
Custom Reports
Good data starts with asking good questions. With Custom Reports, we’ve made it easier for you to drill down to the metrics you need.
In this article:
- Creating a New Report
- Configuring Charts
- Updating Reports
- Editing and Deleting Reports
- Exporting Reports
- Scheduling a Report
- Custom Report Fields
Creating a New Report
To create a customized report, go to Analytics > Custom Reports and select ‘Create Report’. A menu will appear. Give your report a name and description.
In ‘Select report type’, choose which type of data you’d like to use in the report. Choose from three options:
- Conversations - see conversation data, including information about the contact and visit
- Operator - see information about your operators, including average response and rating
- Contact - see information about contacts including demographic, custom attributes, device information, and third-party app involvement
Configuring Charts
Once you’ve selected your report type, select the type of chart you want to create.
Step 1: Name the chart
Step 2: Add fields from the ‘Select Your Data Fields / Columns’ by clicking on ‘+ Add More Data Fields’. Acquire uses fields to track visitor and agent interactions. Create new fields in Custom Attributes.
Step 3: Aggregate field data by using the dropdown menus. There are three options:
- Distinct Count - Counts the number of distinct values available in that column
- Group By - Groups rows that have the same values into aggregate rows, such as "find the number of customers in each country"
- Sum - Adds up the total number of values for a column, such as “find out when average wait times start to negatively impact feedback”
- Average - Averages numerical values, such as “average response times across departments”
- None - Shows the actual value of the field for every row. Recommended for tabular charts such as “show the sites that users are coming from.”
Step 4: Select a data visualization. Depending on the data you’re analyzing, our system will select viable graphs and charts. The options are:
- Table
- Pie chart
- Bar graph
- Line graph
Once you’ve finalized the data and graph type, hit ‘Save’.
Updating a Report
Add or delete data fields and use filters to find relevant data.
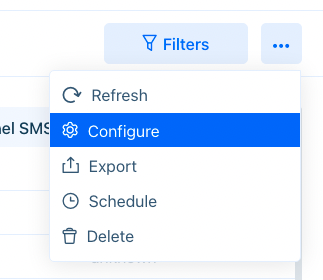
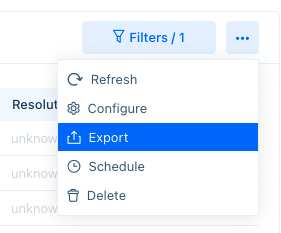
Do you need to add or delete a data field? Select the report you'd like to update. Then click on the three dots ('...') in the upper right-hand corner and select 'Configure.' From this menu, you can add new fields or delete ones that are no longer needed and update your charts as well.

Use the ‘Filters’ button to add conditions to the data in the report. For example, if you created a report for the number of emails your operators sent, you may want to view only the emails that an agent, department, or country sent on a certain date.
Editing and Deleting Reports
Edit or delete a report by clicking on the three dots (‘...’) next to the report’s name.

You’ll have the option to edit or delete the report.
Change the report’s name and description by selecting ‘Edit’. To change the data displayed in the report, refer to the ‘Updating a Report’ section of this article.
Exporting Reports

Each report will display data from that particular agent's timezone. If you work on a distributed team, it may be a good idea to discuss what timezone reports should be exported to. Change an agent's timezone in the profile by clicking on their picture in the bottom left corner of Acquire.
Scheduling a Custom Report
Generate a custom report and have an alert sent to your email address. Scheduling a report is a bit nuanced, so we've broken it out into its own article. Learn more in Scheduling a Custom Report.
Custom Report Fields
See which fields each grouping tracks in the lists below.
Conversations
- Id
- Title
- Description
- Contact Name
- Contact Email
- Visit Id
- Visit Date
- Visit Source URL
- Site URL
- Channel
- Status
- Reopened
- Case Created Date and Time
- Case Last Updated Date and Time
- Case Pending Date and Time
- Waiting Time for Case
- Case Active Date and Time
- Case Closed Date and Time
- Duration of Case
- Total Messages
- Total Sent Messages
- Total Received Messages
- Total Mails
- Total Sent Mails
- Total Received Mails
- Total Read Mails
- Total Unread Mails
- Total Delivered Mails
- Total Replied Mails
- Total Bounced Mails
- Agents Involved
- Feedback
- Tags
- Notes
- Business Apps Involved In Case
- Social Media Involved In Case
- Departments Involved
- Total Calls
- Total Outgoing Calls
- Total Incoming Calls
- Total Missed Calls
- Total Calls Duration
- Total SMS
- Total Outgoing SMS
- Total Incoming SMS
- Total Failed SMS
- Total Cobrowse Sessions
- Cobrowse Sessions Duration
- Total Video Sessions
- Video Sessions Duration
- Total Screen Share Sessions
- Screen Share Sessions Duration
- Case SLA Breach
- SLA Breaches List
- Total SLA Breach
- All Case Custom Attributes
- All Contact Custom Attributes
- Chat Type
- Conversions
Operator
- Operator Id
- Name
- Role
- Departments
- Average Response Time
- Average Rating
- Total Case
- Total Chat
- Total Mails
- Total Sent Mails
- Total Received Mails
- Total of All Calls
- Total Outgoing Calls
- Total Incoming Calls
- Total Missed Calls
- Total Calls Duration
- Total of All SMS
- SMS Sent
- SMS Received
- SMS Failed
Contact
- Contact Id
- Name
- Phone
- City
- State
- Custom Attributes
- Company
- Tags
- IP
- Browser
- OS
- Device
- Contact Date
- Last Contact Date
- Total Cases
- Total Visits
- Notes
- Business Apps Involved In Contact
- Social Media Apps Involved In Contact
- [Custom Attributes will vary]
Account
- Select All
- Session Id
- Contact Id
- Session Creation Date
- Conversation(s) Id
- Impressions
- Clicks
- Chat Requests
- Interactions
- Video Calls Requested
- Video Calls Accepted
- Video Calls Declined
- Video Calls Ended
- Audio Calls Requested
- Audio Calls Accepted
- Audio Calls Declined
- Audio Calls Ended
- Co-browse Requested
- Co-browse Accepted
- Co-browse Ended
- Co-browse Declined
- Conversion Rate
We’re constantly updating our analytics pages to provide you with the type of data you need. Have a suggestion? Reach out to support@acquire.io.
Was this article helpful?


