Analytics
Analytics Basics
Acquire collects and displays a wide array of data based on activity within your instance. Keep track of high-volume hours, chatbot efficacy, and more – all available in the Analytics tab.
In this article:
- Analytics Overview
- General Analytics
- Using Filters
- Exporting Reports
Analytics Overview
The data captured includes public-facing widget activity and agent activity within Acquire.

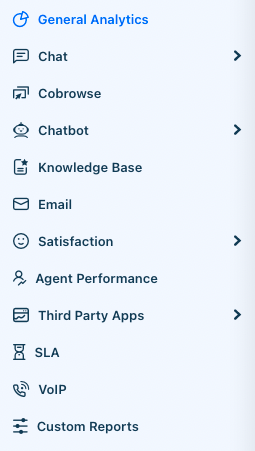
This includes:
- Chat
- Cobrowse
- Chatbot
- Knowledge Base
- Satisfaction
- Agent Performance
- Third Party Apps
- SLA
- VoIP
- Custom Reports
Each reporting area details relevant information like the number of calls or SMS messages sent and received, the average response time, and even how often a specific Business Rule has fired.
General Analytics
Under General Analytics, you’ll find roll-up reporting for cases. This includes hour-by-hour case activity, the total number of cases and their state, and the time it takes to respond to and close a case.
This is further broken down by channel in the next chart.
Finally, a heatmap of the busiest hours will appear for the selected time period.
The time period reflected in the charts can be changed using the date picker in the upper right-hand corner of the dashboard. You can toggle between one day, 7-day, monthly, yearly, and custom time frames. You can also further filter the displayed reports by department.
Using Filters
You may filter by date and department by using the filters buttons at the top right of the graph. Every graph adjusts to match the filtered settings.
Filter by Time
Select a time using either the calendar or left menu.
Filter by Department
Some overviews allow you to filter by department. Select one or multiple departments from the Department Filters drop-down menu.
You're now ready to dive into your analytics pages and make your processes more efficient!
Have a question or suggestion? Reach out to support@acquire.io.
Was this article helpful?


